Key Stage 2 SATs data for Secondaries
Inspired by @resourceaholic's blog post on how secondaries can learn from the Key Stage 2 SATs papers, this is a guide for Heads of Maths and English (or their chosen minions) on downloading test data, both on the day results are released, and in the Autumn when QLA (Question Level Analysis) data is available.
===
PART ONE: JULY
What you need:
1) a login for the Primary Assessment Gateway
2) a list of the UPNs (Unique Pupil Numbers) for your Year 7 intake
3) Excel
4) a cool head and a steady hand
Each secondary school has a "Super User". This is the person who gives you school data access on the Primary Assessment Gateway. It may be the Exams Officer. It may be the Data Deputy. It may even be the Head's PA. But you need to find out who. They will be able to add you to the list of users.
You should register with a school-based email address (not Gmail, Hotmail or other web-based email). Once you are on the list, the Gateway is at https://www.primaryassessmentgateway.education.gov.uk/
Your password must have uppercase, lowercase, numeric and a special character (eg ! $ %).
Paste the list of UPNs into the box and click on 'Search'.
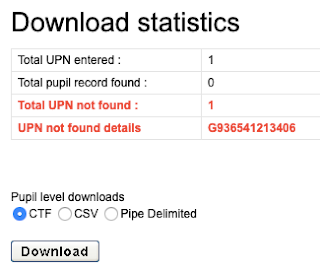
It will show if any UPNs are not recognised (this could mean a typing error into the original spreadsheet, or just that they didn't do the SATs).
Select the CSV button and Download.
Open the CSV file with Excel and save as an XLSX version.
You get data that looks like this:

To give you one to play with, download this Excel file.
Columns A-G are unimportant,
From Column H you have: Name DOB Gender and UPN.
The next important column is P, which lists each subject on a separate line.
If a student has 'L' it means they have left that school, you probably have a duplicate set of data for them from their new primary.
If a student has 'B' it means they were not entered for the tests, as they were working below test standard.
If you see any other letters, ask the primary school!
Now you want to get this data in a manageable form. The easiest way is to sort by column P ('Subject') then column M ('UPN'), remembering to select 'my list has headers'.
Open a new spreadsheet and copy one set of columns H to M for the header row and the first setlist of names (which repeats 5 times).
Copy English data, column AF only
Copy Grammar data, columns U to AB
Copy Maths data, columns S to AB
Copy Reading data, columns Y to AB
Copy Science data, column AE only
Now it's up to you! If you have any questions, feel free to tweet me or email me.
==
PART TWO: SEPTEMBER
What you need:
1) a login for the DfE Sign-in website
2) a list of Year 7 UPNs - hey, you already have them
3) a lot of patience with Government websites
4) Adobe Reader
So with perfect logic, the Question Level Analysis* site is on a totally different system to the PAGs. It's called "Analyse School Performance".
*It isn't at Question Level. That's a big fat lie. You get summary data for different aspects of the curriculum for each student, or question-level data for the whole cohort of students. It is really useful though. But it is not a spreadsheet of all 110 Maths marks for every single student.**
You will probably need to set up another login, even though the sign-in screen looks just like the PAG. Make sure you are writing these passwords down, otherwise you'll get them mixed up
==
Now it's up to you! If you have any questions, feel free to tweet me or email me.
I'll be adding more notes here this month as I explore the data in more detail.
==
** In fact there is a work-around. But it means submitting each student's UPN one at a time, then looking at the question-level analysis. Nobody in their right mind would do this. Just pretend I didn't mention it.
===
PART ONE: JULY
What you need:
1) a login for the Primary Assessment Gateway
2) a list of the UPNs (Unique Pupil Numbers) for your Year 7 intake
3) Excel
4) a cool head and a steady hand
Each secondary school has a "Super User". This is the person who gives you school data access on the Primary Assessment Gateway. It may be the Exams Officer. It may be the Data Deputy. It may even be the Head's PA. But you need to find out who. They will be able to add you to the list of users.
You should register with a school-based email address (not Gmail, Hotmail or other web-based email). Once you are on the list, the Gateway is at https://www.primaryassessmentgateway.education.gov.uk/
Your password must have uppercase, lowercase, numeric and a special character (eg ! $ %).
Don't try to use the same login you have for SATs marking or anything else - this one needs to be linked to your school.
Each new student will have a UPN created by their primary school. Whoever handles transition in your school will have these in a database. You need to be emailed them in a Word or Excel document.
While every student has one, some will not have KS2 scores, if they were educated abroad, or attended an independent school.
Click on 'Available Activity'
Click on 'Search for Pupil KS2 Results'
Paste the list of UPNs into the box and click on 'Search'.

It will show if any UPNs are not recognised (this could mean a typing error into the original spreadsheet, or just that they didn't do the SATs).
Select the CSV button and Download.
Open the CSV file with Excel and save as an XLSX version.
You get data that looks like this:

To give you one to play with, download this Excel file.
Columns A-G are unimportant,
From Column H you have: Name DOB Gender and UPN.
The next important column is P, which lists each subject on a separate line.
- E = English, only a Teacher Assessment for this one
- G = Grammar, scores for Paper 2 and Paper 3, total raw score, scaled score, and Test Outcome
- M = Maths, scores for Papers 1-3, total raw score, scaled score, and Test Outcome
- R = Reading, just one score which equals the raw score, scaled score and Test Outcome
- S = Science, only a Teacher Assessment for this one
- AS means 'at the expected standard'
- NS means 'not at the expected standard'
- EXS means 'has met the expected standard' (English and Science only)
- WTS means 'working toward the expected standard' (English only)
- GDS means 'greater depth than the expected standard' (English only)
- HNM means 'has not met the expected standard' (Science only)
If a student has 'L' it means they have left that school, you probably have a duplicate set of data for them from their new primary.
If a student has 'B' it means they were not entered for the tests, as they were working below test standard.
If you see any other letters, ask the primary school!
Now you want to get this data in a manageable form. The easiest way is to sort by column P ('Subject') then column M ('UPN'), remembering to select 'my list has headers'.
Open a new spreadsheet and copy one set of columns H to M for the header row and the first setlist of names (which repeats 5 times).
Copy English data, column AF only
Copy Grammar data, columns U to AB
Copy Maths data, columns S to AB
Copy Reading data, columns Y to AB
Copy Science data, column AE only
Now it's up to you! If you have any questions, feel free to tweet me or email me.
==
PART TWO: SEPTEMBER
What you need:
1) a login for the DfE Sign-in website
2) a list of Year 7 UPNs - hey, you already have them
3) a lot of patience with Government websites
4) Adobe Reader
So with perfect logic, the Question Level Analysis* site is on a totally different system to the PAGs. It's called "Analyse School Performance".
*It isn't at Question Level. That's a big fat lie. You get summary data for different aspects of the curriculum for each student, or question-level data for the whole cohort of students. It is really useful though. But it is not a spreadsheet of all 110 Maths marks for every single student.**
You will probably need to set up another login, even though the sign-in screen looks just like the PAG. Make sure you are writing these passwords down, otherwise you'll get them mixed up
First visit https://services.signin.education.gov.uk/ to create a login
Then visit https://www.analyse-school-performance.service.gov.uk/

In the top menu bar, click on 'QLA'
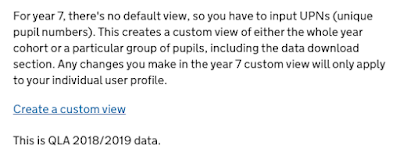
Of course it now says "This is QLA 2021/2022 data".

In the top menu bar, click on 'QLA'

Of course it now says "This is QLA 2021/2022 data".
Got your list of UPNs ready? Good.
Click on 'Create a custom view'.
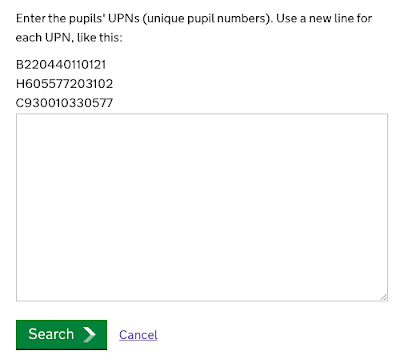
Paste the list of UPNs into the box (you can do this straight from a spreadsheet) and click on 'Search'.
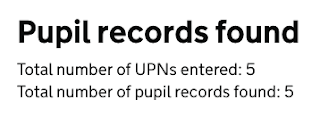
Click on 'Go to custom view'
Click on 'Create a custom view'.

Paste the list of UPNs into the box (you can do this straight from a spreadsheet) and click on 'Search'.

Click on 'Go to custom view'
In the Maths section you can see the success rate in each of 9 strands (only 4 for the arithmetic paper) and the overall total.
The paper 1 strands are:
1) calculations
2) fractions decimals percentages
3) place value
4) ratio and proportion
The paper 2 and 3 strands are:
1) calculations
2) algebra
3) fractions decimals percentages
4) position and direction
5) properties of shapes
6) measurement
7) place value
8) ratio and proportion
9) statistics
Underneath each of the separate papers, you can download the data by question or by pupil.
The first lists all the questions on the paper (which you can also download) and has their completion and success rate.
The second lists all the students in your cohort, and gives their overall success rate, and their success in each strand as a percentage.
These tables can be downloaded as Excel or PDF.
If you want to work with a subset of your cohort, eg a specific class or even one student, you go back to the top of the page and select:
so you can start again with different UPNs.
Now it's up to you! If you have any questions, feel free to tweet me or email me.
I'll be adding more notes here this month as I explore the data in more detail.
==
** In fact there is a work-around. But it means submitting each student's UPN one at a time, then looking at the question-level analysis. Nobody in their right mind would do this. Just pretend I didn't mention it.
